
Chapter 2: Data Analysis and Visualization

Introduction
Working with and in interprofessional teams entering accurate data, communicating with digital information, and retrieving data uses skill sets of health informatics. It is important to recognize and understand what informatics is all about.

According to the American Medical Informatics Association, informatics is applying principles of computer science and information science to advance new knowledge and apply it to research and healthcare delivery. It is used in education and public health as well as for patient care. It is a multidisciplinary or interprofessional methodology, focusing on health information technology (HIT) using computers ( think of entering data and retrieving it), and employing cognitive skills with knowledge of social sciences (“Informatics”, 2023). As nurses and all healthcare providers, we use these skills and knowledge every day in just about every decision we make.
We deal with data in nearly every aspect of our work and daily living. In healthcare, nurses, providers, and the entire interprofessional team use data to make critical clinical decisions. If the data is incomplete or not available, decisions based on what is available could lead to poor outcomes. Understanding how data is collected, entered, stored, and retrieved requires hands on experience, recognizing what it is communicating and how to apply the results of what is retrieved. Entering, retrieving, analyzing, and visualizing data to make decisions is using informatics and technology skills for decision making in large disease outbreaks, delivering care, and even working within the parameters of a budget in a hospital unit.
Learning Objectives for this Chapter
- Demonstrate entering and retrieving data from a spreadsheet program.
- Create tables, bar graphs, and trend lines with the data from the spreadsheet.
- Interpret results of data and how they apply to patient care.
- Compare results of the data analysis and why they are important.
- Effectively communicate results to the interprofessional team using informatics and technology skills.
Healthcare data is extremely valuable for making clinical decisions. Another process that involves data that all nurses should understand is the importance of budgeting. These practice exercises will provide experiences to recognize and work with data elements to analyze several different scenarios.
There are many tools that can be used for data management, analysis, and visualization. For our exercises we are using Excel. For the exercises data are provided to insert into your Excel file and analyze to obtain graphic representation of the data. For each exercise steps are provided on what to do to achieve the required results, followed by questions to interpret the meaning of the results and applications for each context.
To assist in working with the basics of Excel watch the short YouTube video below.

Activity 1
GPAs, SATS, and Exam Grades from First Semester Pathopharmacology Nursing Course
Using data from SATs, and science GPAs from prerequisite courses for admission to professional programs is important to the nursing profession. This data is quantitative information about preparation for successful completion of a nursing degree. Generic student data provided includes SATs, GPAs, and first semester pathopharmacology final grades.
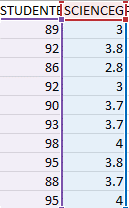
After watching the video above and opening a blank Excel sheet/file, use the data provided to create your own Excel file with three column headings, 1) nursing final test scores, 2) SAT scores, and 3) Science GPAs.
Step 1: Build the table column by column with the respective variables for each column with a clean Excel sheet (see the tables above).
Step 2: In each row insert the data elements specific to the corresponding column.
Step 3: Review the provided instructions (see below) on how to create a table, bar chart, scatter plot and trend line for two to three variables that will answer the questions posed for this exercise.
Step 4: Study the resulting data to answer the questions and provide insights as to what you interpret and what interventions might reduce untoward reportable incidences.
Type in the scores in each column for the three variables into the Excel spreadsheet. Two of the variables are listed as a visual representation to follow.
Select with the mouse the above two columns and highlight them to start creating a chart. Click on ‘insert’ in the menu next to ‘home’. You will see the icon below. Several options will be provided as examples for you to click on.
Use the option below
Click on the icon for recommended charts. Review the options and practice analyzing the data provided with different visual results using the data on the spreadsheet.
One example is to analyze and create a line chart (see image below). See if you can recreate the image below that compares GPA with pathopharmacology grades.

We can see from the example above that GPAs are highly correlated with the final scores for a first semester pathopharmacology grade.
Analyze the data with the other variables in different combinations and consider what the results are communicating.
Study the resulting data to answer the questions and provide insights as to what you interpret and what interventions might reduce untoward reportable incidences.
Next consider how you would answer the following questions:
- What does this tell you when seeing the results in the table?
- What do you conclude about the relationships?
- How can it make a difference in knowledge, skill, and application for critical thinking as a nurse?
Activity 2
Budgets
Budgets are necessary for any organization whether for profit or non-profit. In this exercise use the data provided to input into an Excel spreadsheet.
For the columns create titles for six months:
- Column 1: Staff or commodity
- Column 2: January
- Column 3: February
- Column 4: March
- Column 5: April
- Column 6: May
- Column 7: June
Then enter the data below into each row under the corresponding column.
4 RNs at $80,000 per RN per year = 320,000
5 LPNS at $50,000 per LPN per year = 250000
10 CNAs at $40,000 per CNA per year 400,000
2 Environmental services $30,000 per year = 60,000
Electricity per year $12,000 per year
Computers maintenance, repair, replace $10,000 per year
Use the table below as a guide to enter the information in an Excel spreadsheet.
| Staff or Commodity | January | Feb | March | April | May | June |
| 4RNS | $26,666.00 | $26,666.00 | $26,666.00 | $26,666.00 | $26,666.00 | $26,666.00 |
| 3LPNS | $20,833.00 | $20,833.00 | $20,833.00 | $20,833.00 | $20,833.00 | $20,833.00 |
| 10 CNAs | $33,333.00 | $33,333.00 | $33,333.00 | $33,333.00 | $33,333.00 | $33,333.00 |
| EnviroServe | $5,000.00 | $5,000.00 | $5,000.00 | $5,000.00 | $5,000.00 | $5,000.00 |
| Computers | $833.00 | $833.00 | $833.00 | $833.00 | $833.00 | $833.00 |
| Electrical | $1,000.00 | $1,000.00 | $1,000.00 | $1,000.00 | $1,000.00 | $1,000.00 |
Next:
- Type in the word Total in the column of Staff or Commodity
- Add each column for total budget for each month
- To calculate the total budget of the six months add the total row for each month which should be $525,990.00
- Calculate what the monthly salary or charge is for each line item above for a six-month period. You can do this in Excel by clicking on a cell, typing =320000/12 click enter. Use the result to then enter for the six variables above for six months. The resulting table should look like the table below (after step 5).
- Create a pie chart with the data in the table below after entering it in Excel. Follow the steps to find the recommended charts and choose pie chart to create a visual representation of the table below. Your pie chart should look similar to what is pictured below.
| Six Month Budget | |
| 4 RNs | 159,666 |
| 5 LPNS | 124,998 |
| 10 CNAs | 199,988 |
| Enivor ser | 30,000 |
| Computers | 4,998 |
| Elec | 6,000 |
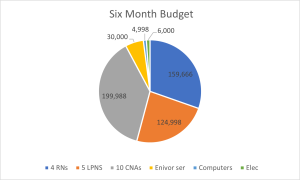
If any computers need to be replaced with new ones, how could you manage this, while staying within budget? When we search for information to discover how budgets are impacted, the cost to keep technology current and on the cutting edge is critical. The impact from COVID 19 led to innovative changes and interventions. Other areas of concern that technology faces in delivering care as well as across many areas is cybersecurity. To stay on top of security it requires investing in technology, maintaining and staying current and up to date to protect sensitive data. This comes with a cost. When we search on the web we see a great deal of information regarding the necessity to upgrade systems, replace legacy systems due to the many technological advances requiring faster computing time, and more hardware and memory to interface and be interoperable with other systems without compromising the privacy of patient data.
Activity 3
Patient Falls

Watch this short video: “Fallsafe – Put the patient first. Preventing falls in Hospital.”
As a nurse you would be presenting this data to your supervisor as evidence to move forward to implement evidence based measures to reduce incidences of falls. What did you glean from the video to answer the question below?
After viewing the video on hospital falls, open up an Excel file to enter ‘Patient Falls’ for the three units listed below.
This exercise highlights issues for patients falls whether in a healthcare facility or at home.
Work at extracting and examining healthcare data elements from a spreadsheet.
| Exercise for Patient Falls | |||
| Pt Fall Type | Unit 1 | Unit 2 | Unit 3 |
| OOB | 4 | 3 | 2 |
| Slipped | 5 | 6 | 2 |
| Confused | 10 | 15 | 13 |
| Meds | 6 | 20 | 4 |
| Lighting | 3 | 4 | 6 |
| Wet | 2 | 3 | 5 |
Use the data in your Excel sheet as you did earlier to design charts. Work with the options for charts to recreate the bar and line graphs shown below.
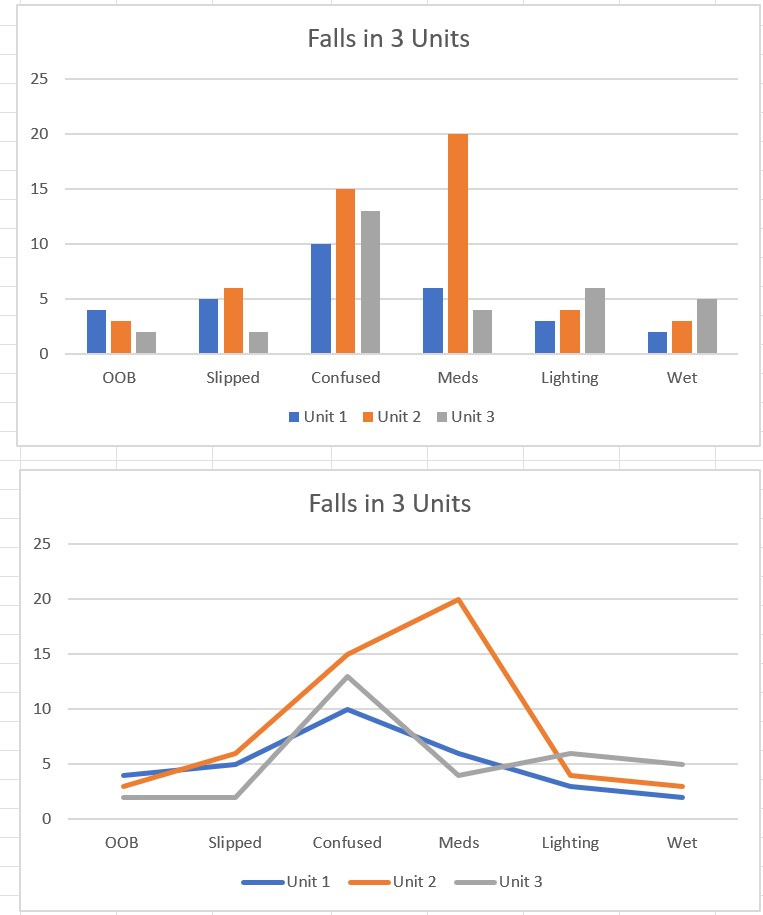
Based on the graphics above:
Activity 4
Patient Data Snapshot

Several disciplines enter different types of patient data based on their involvement in delivering patient care. We also see where more than one discipline can enter specific data. Generally what we find is:
- Respiratory Therapists enter O2 data from vents and vent settings.
- Nurses and CNAs enter vital signs and nursing specific interventions.
- Physicians enter orders and interventions, as well as results of interventions and more.
- Dieticians enter recommendations for diet interventions based on lab work and patient conditions.
- Social Workers enter information from their assessment of disparities for patients and families, needs for services after discharge, and work to help locate coverage for needed care and in many cases financial help. An example of financial help could be helping family and patients apply for Medicaid coverage.
Next:
Open your Excel spreadsheet to a new sheet and enter the data as you see in the table below into the spreadsheet.
The variables to enter as columns in the Excel spreadsheet are:
Systolic, diastolic, O2 Vent, Number of Medications, Physician orders, Nurse interactions, CNA interactions, Dietician interactions, and Social Worker interactions.
| PATIENT DATA SNAPSHOT | ||||||||||
| Exercise for Patient Data | ||||||||||
| Patients | Systolic | Diastolic | O2 Vent/input by Respiratory Therapy | No of Meds | Physician orders | Nurse interventions | CNA interventions | Dietician | Social Workers | |
| 1 | 130 | 90 | 50 | 15 | 10 | 30 | 15 | 3 | 2 | |
| 2 | 190 | 100 | 90 | 20 | 20 | 50 | 16 | 4 | 10 | |
| 3 | 110 | 50 | 20 | 5 | 4 | 15 | 5 | 3 | 2 | |
| 4 | 120 | 86 | 40 | 10 | 4 | 10 | 4 | 3 | 2 |
Review the prior steps as to how to find the options to create charts using the data above to generate two different bar charts, examples of which are shown below. One should provide a patient data snapshot for blood pressure, O2 from vent, number of meds ordered and providers for the 4 patients. The other should just have the patient data snapshot that includes blood pressure, O2 from vent, and number of meds ordered.

Look at that data and determine which disciplines were involved in inputting the data. Think about how the interprofessional team collaborates and communicates using technology and information to later make clinical decisions.
This highlights the many disciplines involved in patient care and inputting data into a computerized database such as, physicians, social workers, respiratory therapists, physical therapists, nurses, CNAs, and even other technicians.
Answer the following questions:
After reviewing the bar chart showing the four patients with data entered for each variable having access to that data from all of the disciplines is critical in communication and collaboration within and between the members of the interprofessional team for critical clinical decision making.
Interoperability
With electronic medical records (EMRs) and interoperability of systems providers can open up results of CT Scans of brains within the EMR at a given workstation or computer. Click on the image below or this link to watch a 3d graphic of a CT Scan of a brain.

After viewing the 3d image above look at the image below:

Review both images and then answer the questions below.
Conclusion
In this short chapter data generation, input, retrieval, and review are presented and discussed. There is a great deal that each exercise provides in recognizing the value of using data for budgets and to make clinical decisions. Being able to manage, analyze, and interpret data is critical for all healthcare, particularly within interprofessional teams.
References
Informatics: Research and practice. (2023).AMIA. https://amia.org/about-amia/why-informatics/informatics-research-and-practice
Mental health. (2022). Wikipedia [Image]. https://en.wikipedia.org/wiki/Mental_health
Neuroinformatics in healthcare. (n.d.) User-FastFission-brain.gif [Video].
https://en.wikipedia.org/wiki/Health_informatics#/media/File:User-FastFission-brain.gif
Technology for teachers and students. (2017). The beginner’s guide to Excel-Excel basics tutorial.
https://www.youtube.com/watch?v=rwbho0CgEAE.
Media Attributions
- updated graphic pathopharmacology
- Interproffessional collaboration is licensed under a CC BY (Attribution) license
- CT Scan Imaging of BraIn is licensed under a CC BY (Attribution) license
- Bleed in Brain is licensed under a CC BY (Attribution) license
